Not so smart metering
Introduction
This project has been a while in the making, and I’ve finally got round to finishing it off (well as much as anything is finished). A big part of the delay was, somewhat ireonically, not having a power socket near the meters.
I’m not a huge fan of Smart Meters - being able to be cut off remotely doesn’t seem a selling point, but I was curious how much energy I was using. I built a circuit with the Raspberry Pi to keep track of much gas and electricity I was using - this uses the GPIO pins to count the flashes on the electricity meter, using an LDR, and to count the rotations of the gas meter using a Hall probe (it turns out the 0 has a magnet in it, which can be detected as it rotates).
The measurements are much more precise for the electic meter - there are 1000 flashes per kWh, compared to ~9 per kWh for the gas meter.
I was originally simply dumping the timestamps (and time difference between successive ones for each power source) into a CSV file, and looking at this in R.
I wanted to make something where I could see at a glance how much energy I’d been using. I had an old Nook E-Reader, which I planed to use as a display. This blog post was very useful in figuring out how to do this.
tldr; it runs Android 2.x, the apks linked to on that page were sideloaded via adb, so no need to set up a Google Account. The plan was to use Electic Sign to display a web page containing the current power usage.
Sqllite and FastAPI
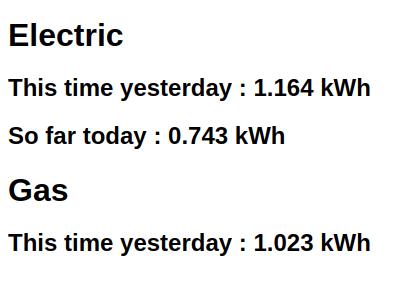
I’ve now switched to dumping the timestamps to a sqllite database, and am using FastAPI to generate an endpoint that I can display on the Nook:
Futher work
I plan to move the logging over to a “proper” database. Handling timestamps in Sqllite is a little fiddly. Doing some visualisation of the data is also on the list.
Code is here